Overview
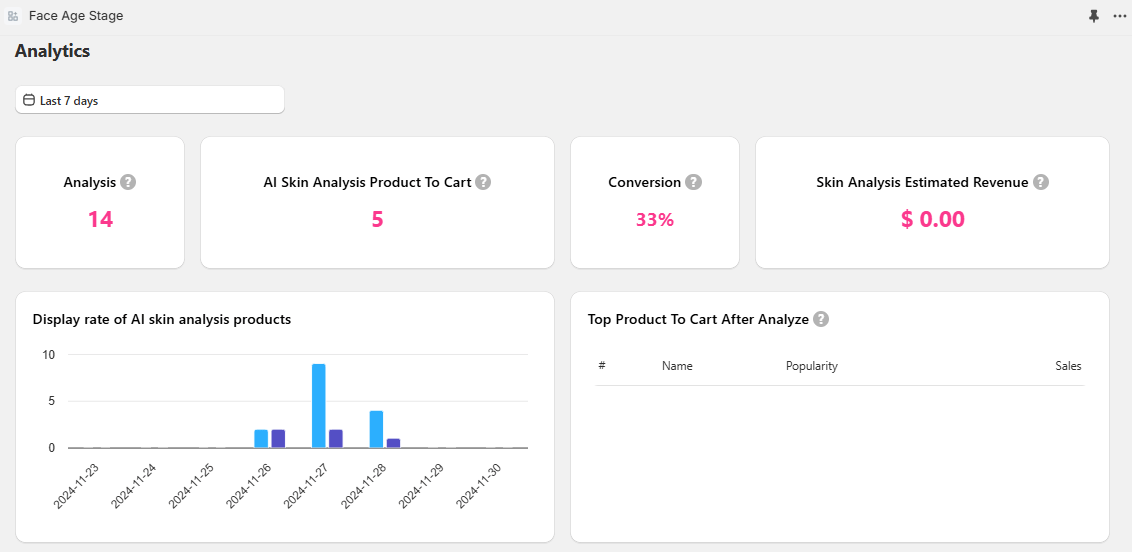
Key metrics

Product performance
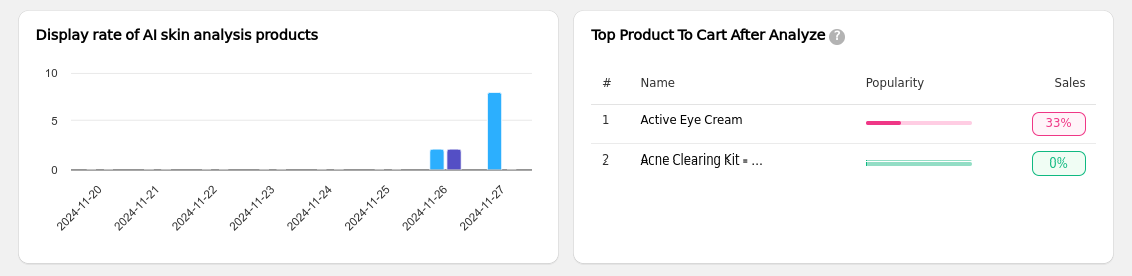
Display rate of recommended products
A bar chart of how many products were shown to users each day after analysis. Use it to track product visibility and peak engagement days.Top products added to cart after analysis
A table of your most popular and effective recommendations:- Name — product name.
- Popularity — percentage of users who added the product to their cart after analysis.
- Sales — conversion rate for the product.
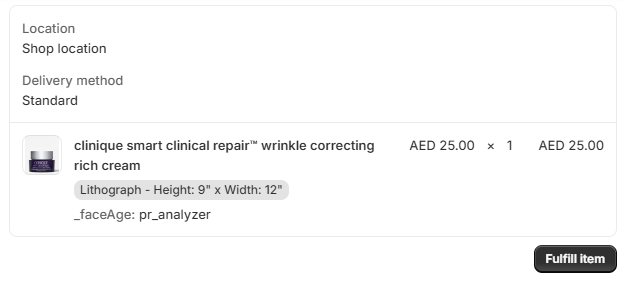
To measure the sales of products recommended by Face Age accurately, check the Orders section in Shopify. When a product is added to the cart after a Face Age recommendation, the order gets a Face Age tag.
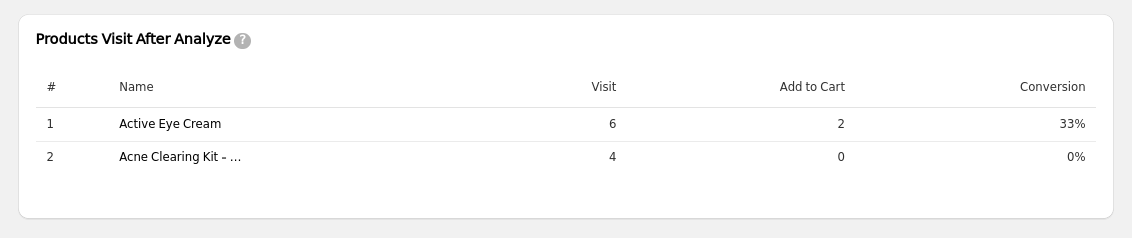
Products visited after analysis
A table showing how customers interact with recommended products:- Name — product name.
- Visit — visits to the product detail page.
- Add to cart — times the product was added to the cart.
- Conversion — percentage of product page visits that led to a purchase.
Usage trends
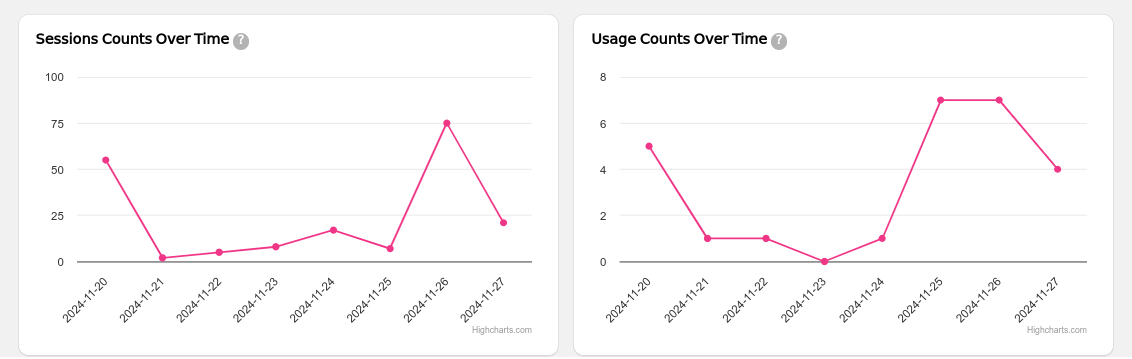
- Sessions count over time — a line chart of user sessions with the skin analysis feature, per day. Tracks engagement trends.
- Usage count over time — a line chart of analyses performed per day. Tracks adoption and usage patterns.